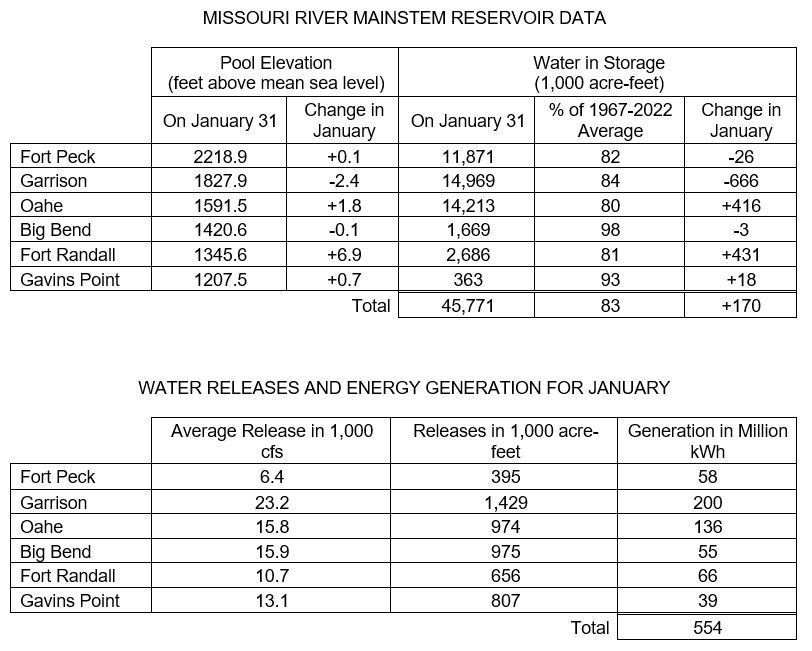
Tables showing water storage and releases and power generation.
MISSOURI RIVER MAINSTEM RESERVOIR DATA
Pool Elevation
(feet above mean sea level)
Water in Storage
(1,000 acre-feet)
On January 31
Change in January
On January 31
% of 1967-2022 Average
Change in January
Fort Peck 2218.9 +0.1 11,871 82 -26
Garrison 1827.9 -2.4 14,969 84 -666
Oahe 1591.5 +1.8 14,213 80 +416
Big Bend 1420.6 -0.1 1,669 98 -3
Fort Randall 1345.6 +6.9 2,686 81 +431
Gavins Point 1207.5 +0.7 363 93 +18
Total 45,771 83 +170
WATER RELEASES AND ENERGY GENERATION FOR JANUARY
Average Release in 1,000 cfs
Releases in 1,000 acre-feet
Generation in Million kWh
Fort Peck 6.4 395 58
Garrison 23.2 1,429 200
Oahe 15.8 974 136
Big Bend 15.9 975 55
Fort Randall 10.7 656 66
Gavins Point 13.1 807 39
Total 554
| Date Taken: | 02.07.2023 |
| Date Posted: | 02.07.2023 13:46 |
| Photo ID: | 7621282 |
| VIRIN: | 230207-A-A1408-001 |
| Resolution: | 812x651 |
| Size: | 100.46 KB |
| Location: | OMAHA, NEBRASKA, US |
| Web Views: | 29 |
| Downloads: | 4 |

This work, Below average runoff continues for the upper Missouri River Basin in 2023 [Image 2 of 2], by Eileen Williamson, identified by DVIDS, must comply with the restrictions shown on https://www.dvidshub.net/about/copyright.