
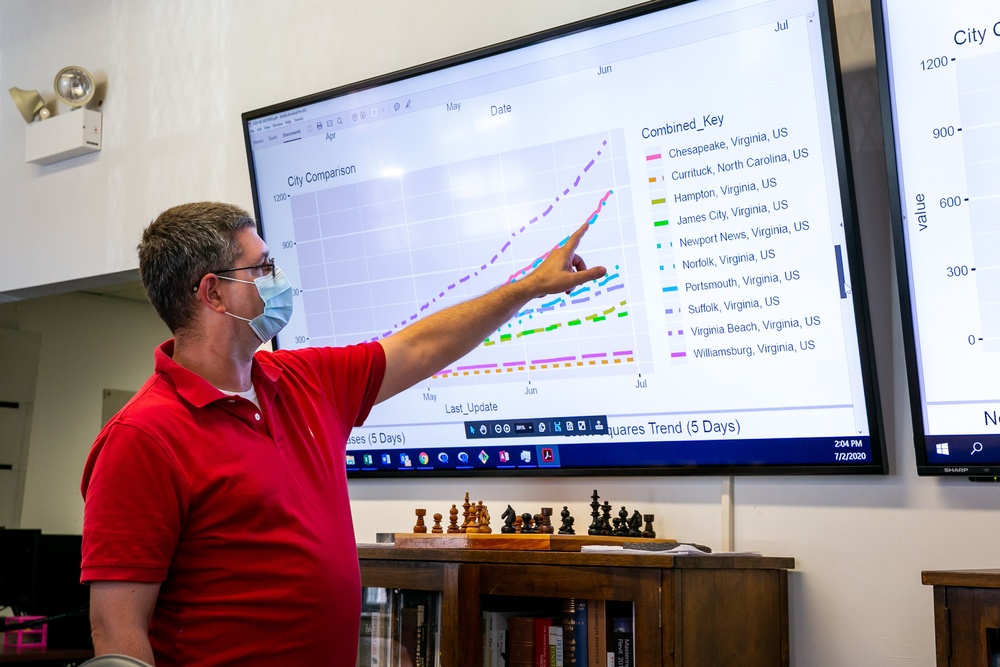
Code 105.4 Health Physicist William Young explains data collected regarding COVID-19 cases in the Hampton Roads area.
| Date Taken: | 07.02.2020 |
| Date Posted: | 08.11.2020 08:50 |
| Photo ID: | 6303531 |
| VIRIN: | 200702-N-YO710-002 |
| Resolution: | 3409x2273 |
| Size: | 1.53 MB |
| Location: | PORTSMOUTH, VIRGINIA, US |
| Web Views: | 62 |
| Downloads: | 9 |

This work, Eye on Innovation: Data Analytics Community of Action Helps America’s Shipyard Expand its Horizons [Image 2 of 2], by Shelby West, identified by DVIDS, must comply with the restrictions shown on https://www.dvidshub.net/about/copyright.


Eye on Innovation: Data Analytics Community of Action Helps America’s Shipyard Expand its Horizons
No keywords found.