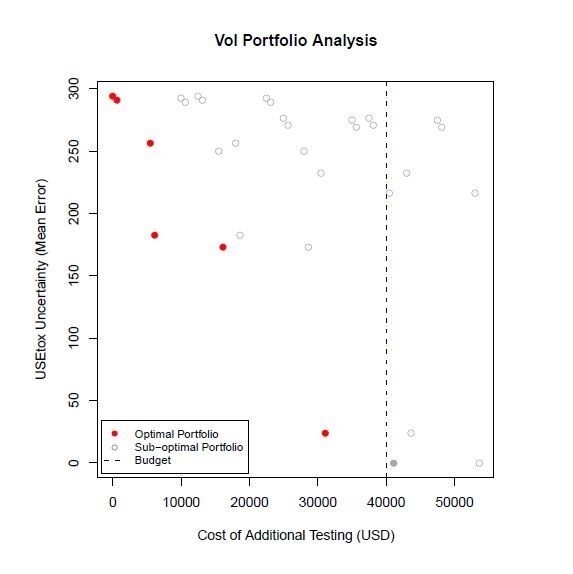
The screenshot shows the output results of the FELCI software. The x-axis refers to the cost of testing, with the vertical line drawn at an example input available budget of $40K. The y-axis shows the mean error calculated of the impact score from the USEtox Lifecycle Assessment method. The plot shows the Pareto front, where the optimal portfolio of tests are presented in red, based on the environmental tests described in the Army’s Developmental, Environment, Safety and Health Evaluation document. The plot shows the degree of error reduction in the LCA impact score achieved with each increment of additional money for testing. (Image courtesy of Dr. Mark Chappell, ERDC)
| Date Taken: | 11.14.2019 |
| Date Posted: | 11.18.2019 17:13 |
| Photo ID: | 5919664 |
| VIRIN: | 191118-A-A1403-001 |
| Resolution: | 573x574 |
| Size: | 54.2 KB |
| Location: | US |
| Web Views: | 8 |
| Downloads: | 3 |

This work, FELCI screenshot, must comply with the restrictions shown on https://www.dvidshub.net/about/copyright.
LEAVE A COMMENT