
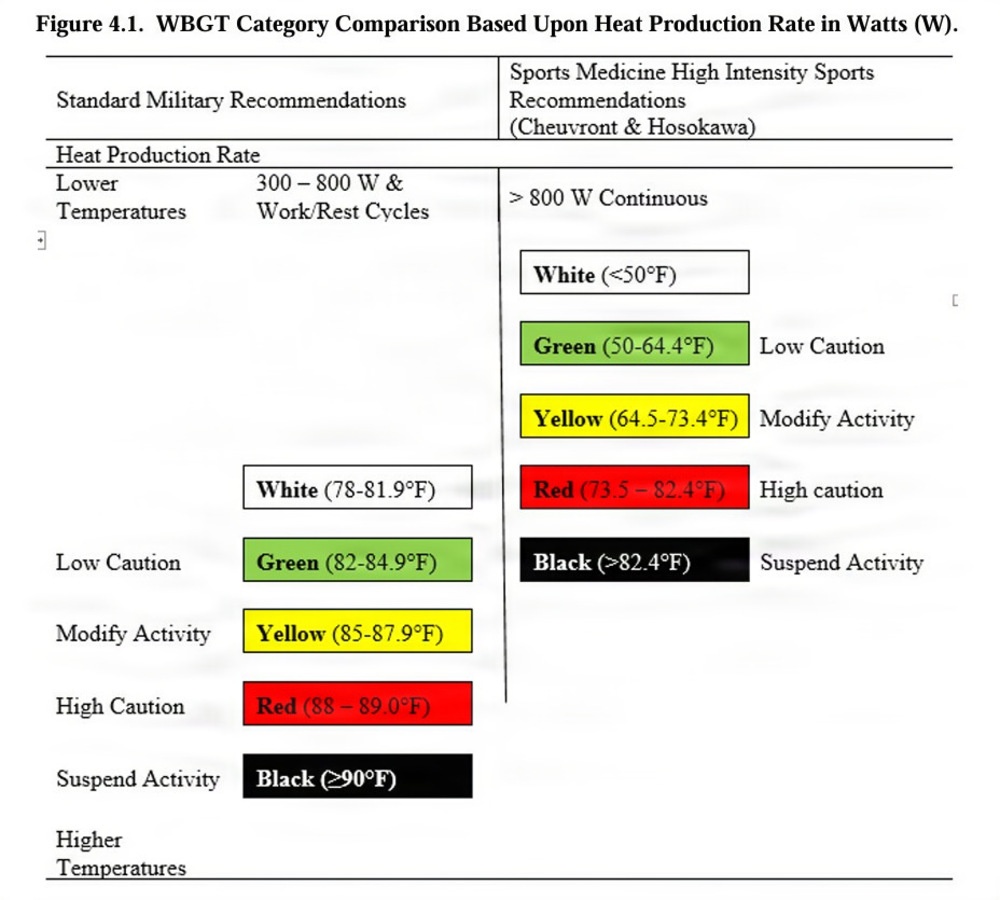
A screenshot of "Figure 4.1, WBGT Category Comparison Based Upon Heat Production Rate in Watts (W)" from Department of the Air Force Instruction 48-151 (Thermal Stress Program) is shown above. The chart shows different flag conditions for normal vs. high-intensity activity. (U.S. Air Force graphic)
| Date Taken: | 08.14.2026 |
| Published: | 08-27-26 05:02 PM |
| Graphic ID: | 44492 |
| VIRIN: | 260814-D-F3403-8742 |
| Size: | 134.42 KB |
| Location: | US |
| Web Views: | 1 |
| Downloads: | 0 |

This work, Chart from DAFI 48-151, must comply with the restrictions shown on https://www.dvidshub.net/about/copyright.