NASA Satellites Measure Earth's Metabolism: Image of the Day

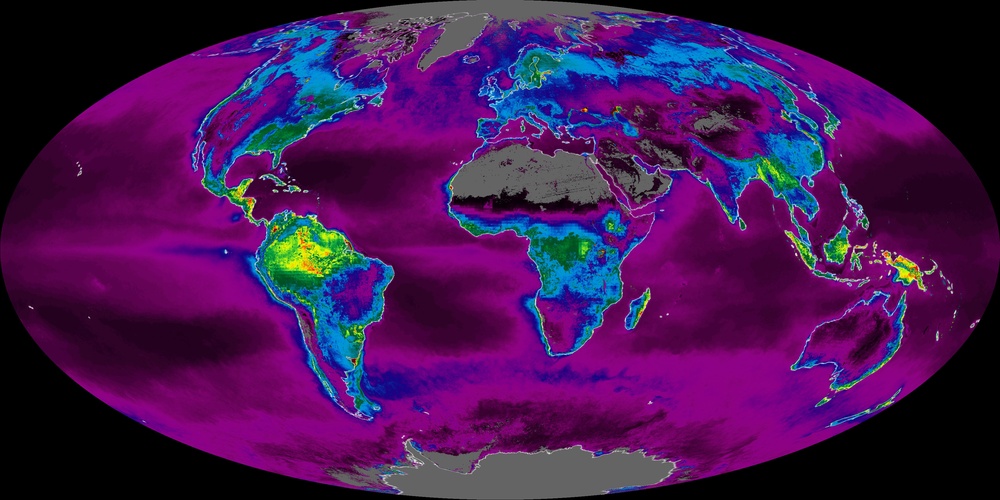
In honor of the Earth Day celebration, NASA scientists unveiled the first consistent and continuous global measurements of Earth's ''metabolism.'' Data from the Terra and Aqua satellites are helping scientists frequently update maps of the rate at which plant life on Earth is absorbing carbon out of the atmosphere. Combining space-based measurements of a range of plant properties collected by the Moderate Resolution Imaging Spectroradiometer (MODIS) with a suite of other satellite and surface-based measurements, NASA scientists produce composite maps of our world's ''net primary production'' every 8 days. This new measurement is called net production because it indicates how much carbon dioxide is taken in by vegetation during photosynthesis minus how much is given off during respiration. Scientists expect this global measure of the biological productivity of plants to yield new insights into how the Earth's carbon cycle works, a critical step toward solving the climate change puzzle. The rate of carbon fixation through photosynthesis is a basic property of life on planet Earth. It is the basis for capturing and storing the energy that fuels our world's living systems and forms the foundation of the food webs. The oxygen we breathe is a byproduct of this photosynthesis. According to its creators, these new net primary productivity maps provide a fascinating new insight into the intimate connection between the living world and the physical world. These false-color maps represent the Earth's carbon ''metabolism'' -- the rate at which plants absorbed carbon out of the atmosphere during the years 2001 and 2002. Each map shows the global, annual average of the net productivity of vegetation on land and in the ocean. The yellow and red areas show the highest rates, ranging from 2 to 3 kilograms of carbon taken in per square kilometer per year. The green areas are intermediate rates, while blue and purple shades show progressively lower productivity. In any given year, tropical rainforests are generally the most productive places on Earth. Still, the ongoing productivity near the sea's surface, over such a widespread area of the globe, makes the ocean roughly as productive as the land. For more information and images, read: /Newsroom/NPP/npp.html NASA Satellite Measures Earth's Carbon Metabolism
NASA Identifier: psn.modis.2002
| Date Taken: |
06.29.2011 |
| Date Posted: |
10.10.2012 17:46 |
| Photo ID: |
714867 |
| Resolution: |
3600x1800 |
| Size: |
1.24 MB |
| Location: |
WASHINGTON, DC, US |
| Web Views: |
75 |
| Downloads: |
13 |
PUBLIC DOMAIN

MORE LIKE THIS
CONTROLLED VOCABULARY KEYWORDS
TAGS


LEAVE A COMMENT